
Run a ‘work’ report.
Click ‘Reports’ and ‘New work report using your own criteria’. Click ‘run report’ to see the numbers.
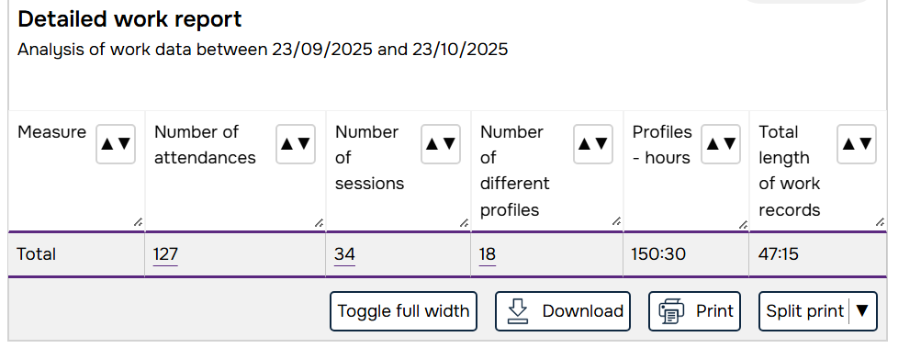
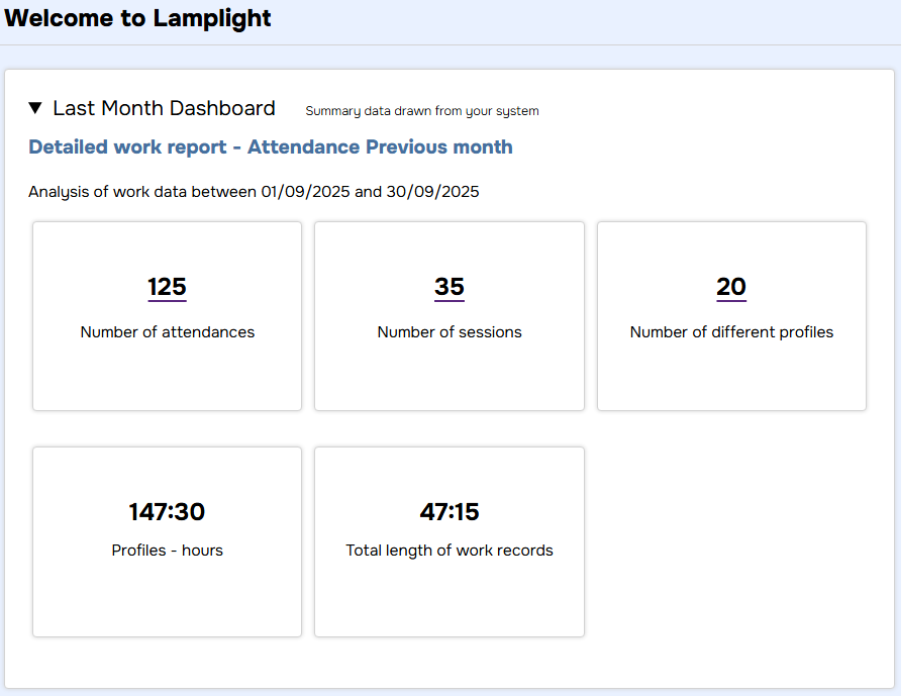
You’ll see total figures for:
- Number of attendances – aka number of ticks on the register
- Number of sessions
- Number of different profiles
In this example, 18 different people came 127 times, to 34 different sessions run during the month.
Use the filters near the top of the screen (click ‘Report filters’). Select the services you need figures for, and click ‘Run Report’.
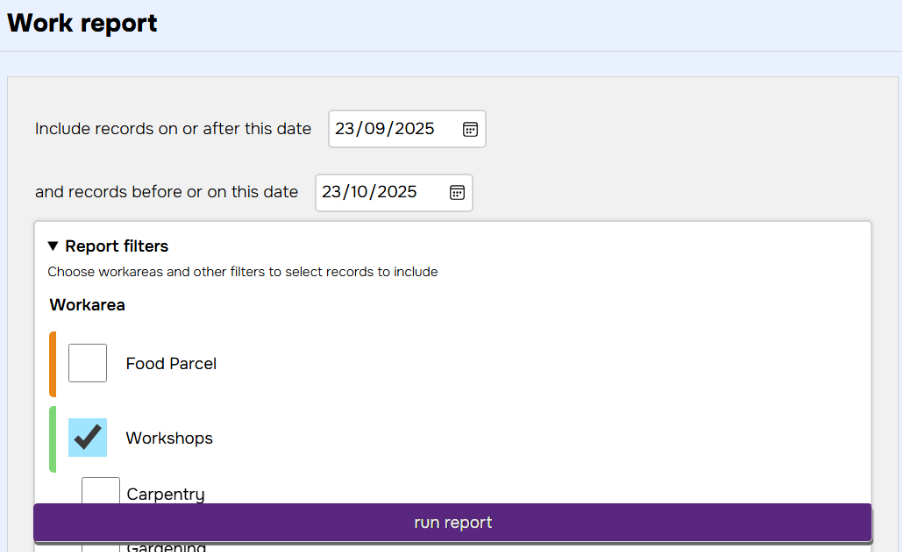
The figures in the table will update.
There are lots more filters there, and it’s even possible to do things like “show me the number of cancellations from people aged 22 to 37 living in postcode areas NE1 or NE2” if you really need to (but that’s for another time).
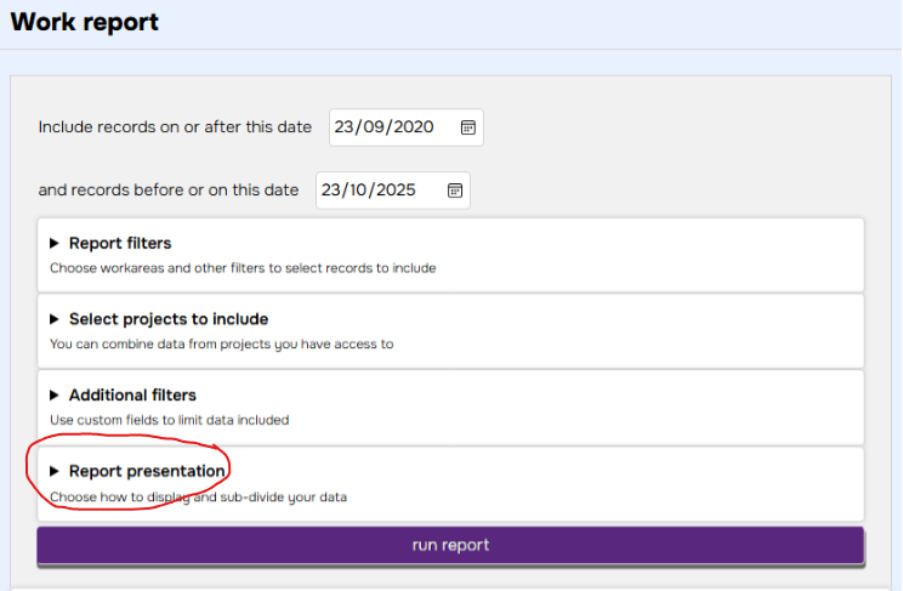
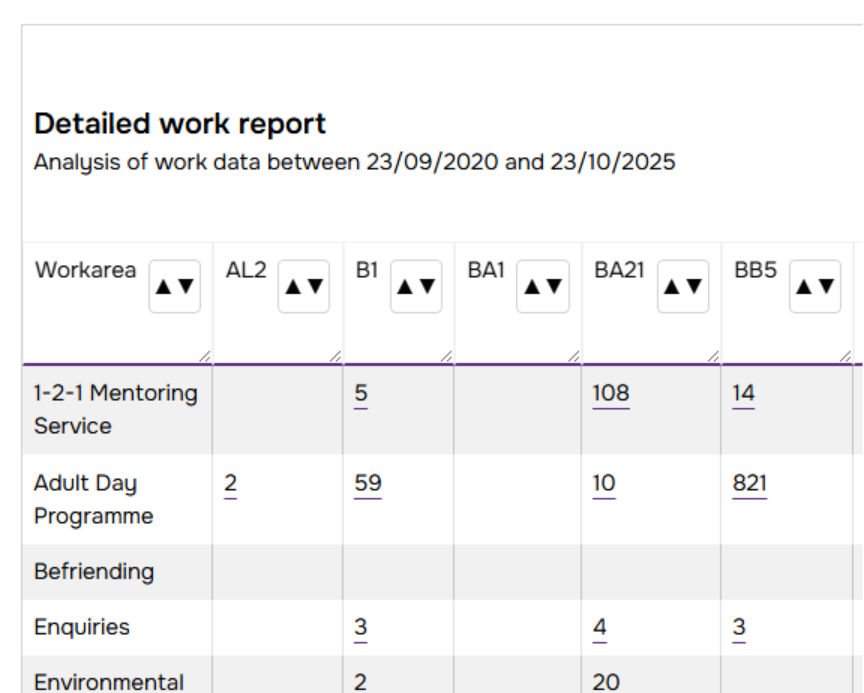
Yes – still in work reports, go to the ‘Report presentation’ section.
Choose ‘Workarea’ for the rows, ‘Postcode (first part)’ for the columns, and ‘Number of attendances’ in Data to show, like this:
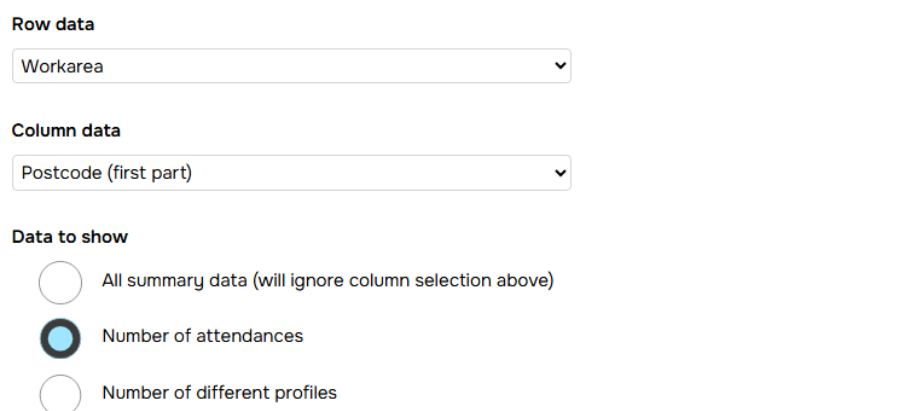
Click the ‘run report’ button to update the table. You’ll see something like this, with postcode areas along the top and your services down the side.
There are a ton of options in there – if you’re collecting the data, you’ll be able to use it in your reports.
You need to create an ‘Auto List’ (sometimes known as ‘Auto group’), and use this in your reports. There are probably a load already in your system – if you look in ‘Report filters’ you may see a drop-down labelled ‘List’ or ‘Group’. Selecting something from there will limit the report just to people in that list.
There are loads of options when creating lists – you can base them on location, client attributes, but also things like “people who’ve attended more than 10 sessions in the last quarter” or “people who’ve seen reduction in a score in their outcome measure”. There’s lots in the help pages to assist you in setting these up, if you need it. Section 27 of the manual is a good place to start.
Run an outcome report. Go to Reports, and select ‘New outcome report using your own criteria’. Click ‘run report’.
You’ll see a table of figures, which is maybe what you need. But keep scrolling down and you’ll see some graphical representations that might be worth some words (1000?).
In this example system, we’re asking people some Health and Wellbeing questions. We ask them to rate how they’re feeling about different aspects of life, and see how that changes over time. This chart shows the average starting point (the inner lilac line with triangles) and average final scores (the darker blue line with diamonds).
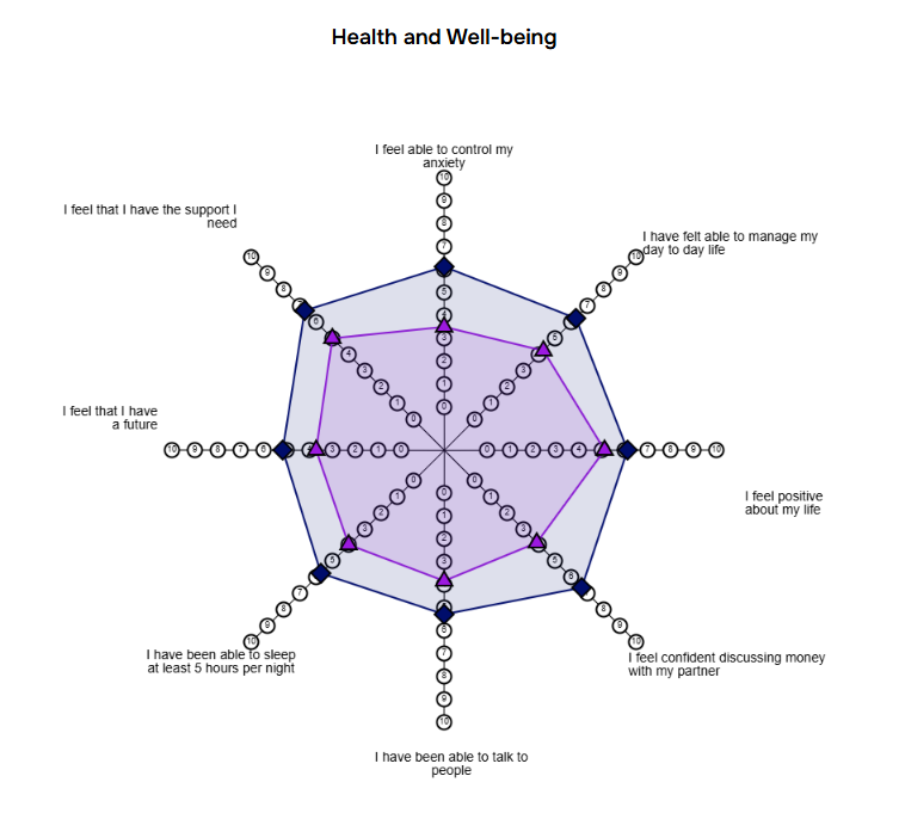
You can see that there’s been an across-the-board improvement on all these measures.
Keep on scrolling and you’ll see this same data in an infographic style:
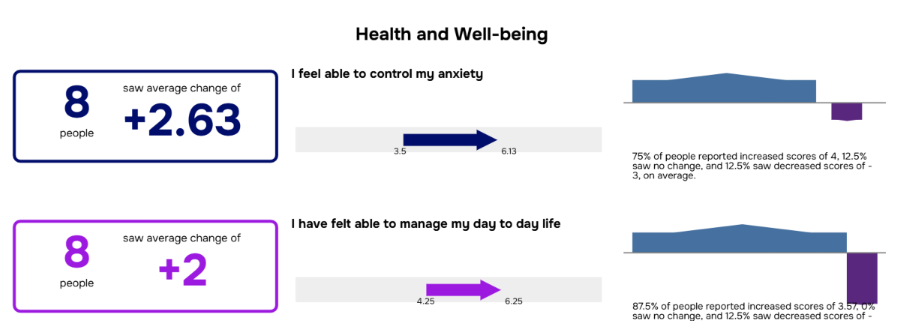
Lamplight customers have won prizes from funders and commissioners with this presentation of their data!
The same filters and things are all available for these reports too, if you need to focus in on particular services etc.
Try the Waiting List report. Go to Reports and then ‘New waiting list report using your own criteria’. Click ‘run report’.
If your organisation is using waiting lists, you’ll see something like this:
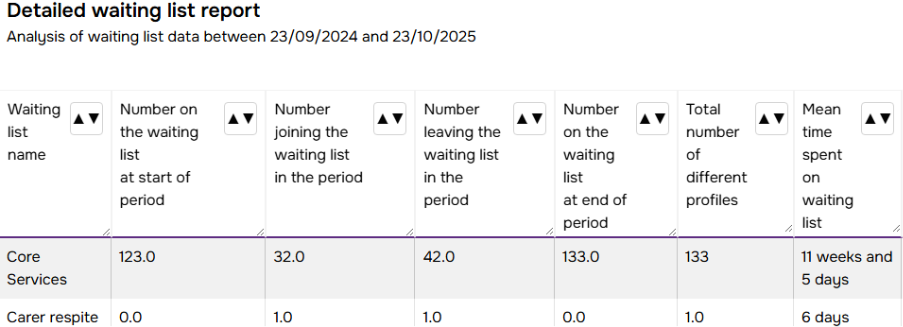
In this example, there’s clearly more demand for our Core Services than we’re able to meet at the moment.
Waiting Lists is one of the Lamplight modules – if you don’t see this option, then you’re not using them (but you can easily start – system admins can add or remove functionality in the main system admin menu).
Try a Referral Report. Go to Reports and ‘New referral report using your own criteria’. Click ‘run report’.
This will show you how many referrals there have been in the period.
You may need to check the filters for this one: some organisations will use this for referrals out to other organisations, or internally within their organisation. Find ‘Referral direction’ and set it to ‘In’.
Yes.
If you’re asking about this when people are referred to you, run a referral report and use the ‘Report presentation’ options to show these. In this system, we added a ‘Support Need’ question, so the report looks something like this:
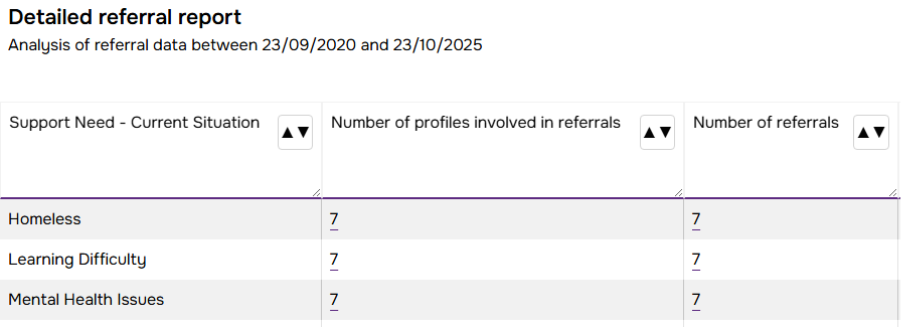
Different organisations gather and store this information in different ways, so you may need to speak to colleagues to check the best way to pull this information out.
Yes, the Reporting Extra module in Lamplight lets you report on key Census and other administrative data, based on the postcodes of your service users. The options appear in the ‘Report Presentation’ section and you’ll get a table that looks something like this.
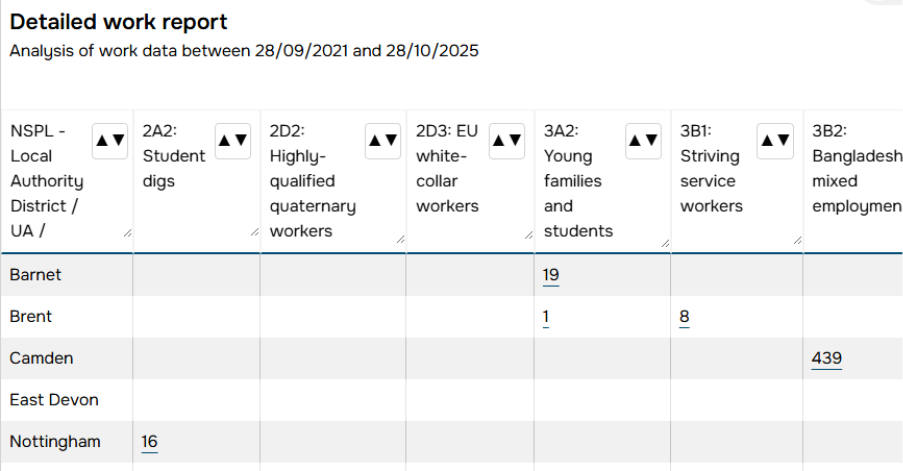
You can use
- Administrative areas (e.g. Local Authority, Parliamentary constituency etc)
- Census data (Classifications, Index of Deprivation, Output Area codes etc)
- Public Service areas (e.g. Health, Police Force Area)
Yes. Report Templates can be used to run frequently used reports in one click. Your system administrator will need to set them up. They can also set up an Operator Template that can add a dashboard to your home page, and link to your regular reports in the Favourites menu (the Star in the top-right corner).
Yes. The Reporting Extra module means you can link your reports to Excel or Power BI, so they can extract the data from Lamplight and process it however you need. You’ll need to do some initial setup, so it depends how often you need the reporting and how ‘live’ it needs to be.
Of course you can still always run ad-hoc reports whenever you need to within the system.
This will depend quite a bit on what you do, and your data. Some of the things you could think about are listed below. These reports and numbers may raise questions, rather than provide lots of answers. They’ll provide a starting point for insightful conversations with your team and your service users.
Are we reaching the people we want to reach?
- Run a work report looking at demographics or other characteristics. Do they roughly tally with your target group (e.g. your local area?)
- Look at number of people, but also how much engagement (the ‘number of hours’ figures). Do different people access more or less of your services?
- Run similar reports for referrals. Are different groups more likely to access your services via different referral routes?
Are some people more likely to drop out than others?
- Create an auto group (aka list) looking for people that have attended at least 3 work records this year, but none in the 3 months (Groups > Add > Auto list. In ‘Work fields’ it’d look something like this:
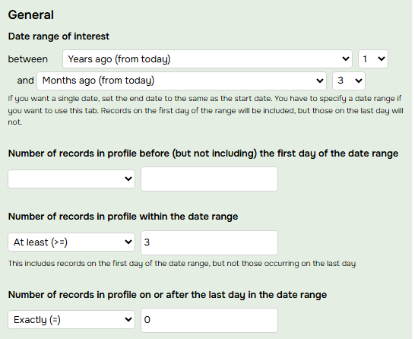
- This will give you a list of people that attended and then stopped. Why was this?
- Tip: you can use Data Views in Lamplight to see more data about a particular group of service users. You can use these to explore in more depth.
Are there differences between subsets of our service users?
All reports can be split by the data you’re capturing, using the ‘Report Presentation’ options. For example,
- you can run a work report split by ethnicity, or postcode, or health status to see if there are differences in service levels
- outcome reports can be split by the data you store in profiles. For example if you suspect females see worse outcomes than men, you can split the reports by gender to see if that’s true (use the ‘Report Presentation section).
- Are you receiving more referrals from people in one area than another?
By running reports broken down in different ways, you may start to see patterns or differences. You can then go and start talking to people to understand why that may be.
Why do some people not see improved scores on our outcomes (i.e. they’re telling us things are getting worse for them)?
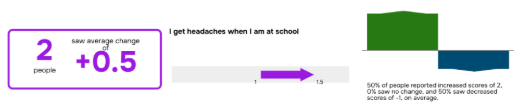
- Run an outcomes report and look at the Infographic. The arrows on the right show the distribution. In this example, although the overall average change was positive, half the people saw (large) positive change, but half saw negative change. Why was this?
- If you have access, you can click on the numbers in all these reports to see who was involved.
- You can also use auto groups to identify people with change over or under certain amounts.
Lamplight’s Information Security Management System is compliant with the Internationally Recognised standard ISO27001:2022, and we’re audited regularly by the BSI. You can download our ISO certificate from the BSI website.
This provides you with the assurance that we are continuously looking out for new threats, assessing the risk they pose, monitoring the controls we have in place to protect your data, and improving or strengthening them as needed. Many public sector funders or commissioners will now require your suppliers to be compliant with ISO27001, and even if they don’t, they should accept it as proof that you’re storing your data securely.
If you want to know a bit more about the security of your data, some more information on our website.
Of course some of the responsibility lies with your organisation: making sure the right people have logins, that you use multi-factor authentication, that you don’t have a shared password that’s on a post-it note on the noticeboard…
A few ways.
- Lamplight is GDPR compliant and has various features that help you meet your obligations. For example, you can easily restrict processing if someone asks you to, and the built-in data management features enable you to securely destroy data when it’s no longer needed.
- The Safeguarding functions in Lamplight are designed to follow best practice, making it easy for anyone to raise concerns. Your Safeguarding lead can then securely and confidentially manage that concern as evidence is gathered, and as you work with the relevant authorities.
- You can enable a full audit log of every action taken in Lamplight, so you know who’s done what when.
- Lamplight’s been designed to meet the very highest standards of accessibility. It’s mostly conformant to WCAG2.2 level AAA. We’ve designed for accessibility from the outset; tested it with users with a range of accessibility requirements, and with external auditors. Team members with accessibility requirements should get on fine with Lamplight out-of-the-box.